2026/5/22
In the first quarter of 2026, China’s apparel industry actively addressed challenges, including weak international market demand and disruptions caused by geopolitical tensions in the Middle East. Supported by positive factors such as the steady recovery of the domestic economy and the effective implementation of policies to expand domestic demand, the industry’s overall economic performance remained broadly stable. Production and domestic sales recorded restorative growth, and exports showed considerable resilience. However, corporate profitability came under severe pressure, and investment growth declined sharply.
Looking ahead to the full year, amid a complex and severe external environment, China’s apparel industry must continue to guard against and mitigate a range of risks and challenges, including escalating geopolitical conflicts, rising trade protectionism, and constraints on international shipping. Industry should accelerate the cultivation of new quality productive forces, steadily advance the development of a modern industrial system, consolidate and enhance its foundational industrial strengths and development resilience, and strive to achieve steady recovery and positive, innovation-driven growth.
(1) Steady Recovery in Apparel Production
In Q1, China’s apparel industry chain operated in an orderly and sound manner, with both the industrial value added and apparel output of enterprises above designated size maintaining modest growth, and growth rates recovering steadily compared with 2025. According to data from the National Bureau of Statistics (NBS), from January to March, the industrial value added of apparel enterprises above designated size increased by 3.1% year on year, with the growth rate rebounding by 6.1 percentage points compared with the full year of 2025. Apparel output of enterprises above designated size grew by 1.36% year on year, with the growth rate rising by 4.80 percentage points compared with the full year of 2025. By subcategory, woven apparel output increased by 0.70% year on year, among which down apparel, suits, and shirts declined by 0.99%, 1.33%, and 9.84% year on year, respectively. Knitted apparel output increased by 1.66% year on year.
Figure 1: Apparel Industry Production Growth Rate in Jan.-Mar., 2026
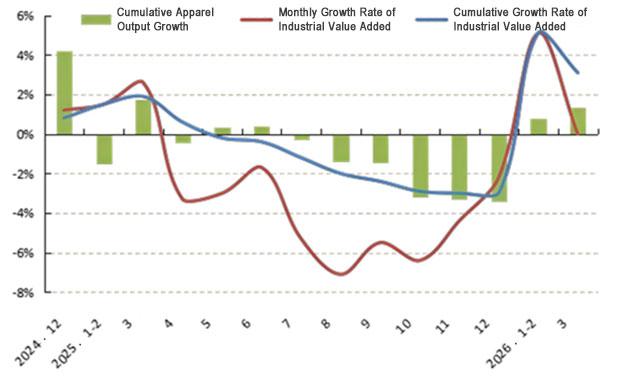
Source: National Bureau of Statistics
(2) Robust Growth in Domestic Sales
In Q1, supported by the strong start to the domestic macroeconomy, the synergistic effect of national policies to boost consumption, and the concentrated release of consumer demand during the Spring Festival holiday, China’s domestic apparel sales market grew relatively rapidly. According to NBS data, from January to March, retail sales of clothing by enterprises above designated size totaled 303.26 billion yuan, up 9.4% year on year, with the growth rate accelerating by 6.6 percentage points compared with the full year of 2025. Specifically, retail sales of clothing by enterprises above designated size grew by 10.7% and 6.6% year on year in January–February and March, respectively. During the same period, online apparel sales notably accelerated, with online retail sales of apparel products increasing by 11.6% year on year, up 9.7 percentage points from the full-year rate of 2025.
Figure 2: Domestic Apparel Sales Performance in Jan.-Mar., 2026
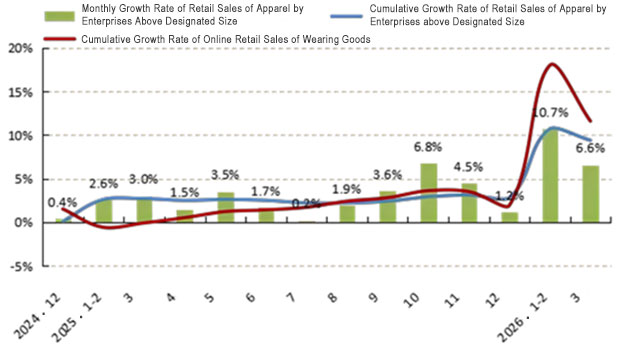
Source: National Bureau of Statistics
(3) Exports Under Pressure While Demonstrating Resilience
In Q1, against the backdrop of weak international market demand, intensifying geopolitical conflicts, and rising trade policy uncertainty, export enterprises actively addressed challenges and risks, including rising international shipping costs and disrupted order delivery. China’s apparel exports remained broadly stable overall, demonstrating considerable resilience. According to China Customs data, from January to March, China’s cumulative exports of apparel and accessories amounted to US$32.89 billion, down 0.4% year on year. The decline narrowed by 1.5 percentage points compared with the same period of 2025 and by 4.6 percentage points compared with the full year of 2025. In terms of volume-price dynamics, apparel exports continued the trend of rising volume and falling prices: export volume reached 8.38 billion pieces, up 6.6% year on year, while the average unit price was US$3.2 per piece, down 6.2% year on year. On a monthly basis, export growth showed significant volatility. In January–February, driven by the concentrated delivery of pre-holiday orders, apparel exports grew by 14.8% year-on-year. In March, affected by the high base created by front-loading exports to the United States in the same period of the previous year, apparel exports declined by 29.4% year-on-year.
Figure 3: China’s Exports of Apparel and Accessories in Jan.-Mar., 2026
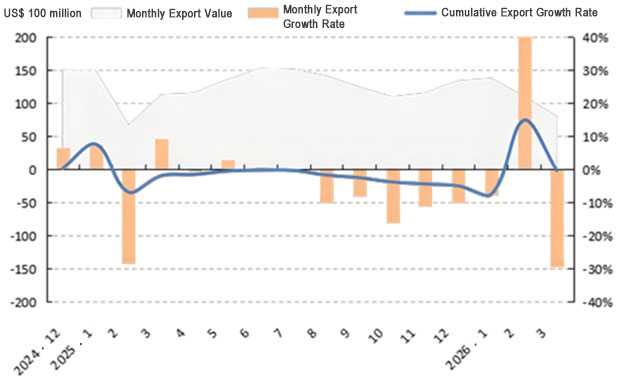
Source: China Customs
By subcategory, export values for casual suits and jackets increased by 22.6% and 6.2% year-on-year, respectively, while those for formal suits, T-shirts, and knitwear each edged up by 0.3% year-on-year. Export values of other major apparel categories all declined. Trousers, dresses, and shirts saw year-on-year declines in export value of 0.6%, 5.3%, and 0.5%, respectively. Down apparel showed rising volume and falling prices, with export volume up 1.4% year on year and the unit export price down 10.5% year on year.
Among major markets, the structure of China’s apparel export markets shifted more rapidly, with divergent trends across the United States, European Union, and Japanese markets, while emerging markets such as Latin America and Africa maintained relatively strong growth. According to China Customs data, from January to March, China’s apparel exports to the United States amounted to US$7.25 billion, down 2.5% year on year, with the decline narrowing by 9.5 percentage points compared with the full year of 2025. Apparel exports to the EU reached US$5.24 billion, up 4.9% year on year, with the growth rate accelerating by 1.9 percentage points compared with the full year of 2025. Apparel exports to Japan totaled US$2.80 billion, down 4.3% year on year, with the growth rate declining by 5.2 percentage points compared with the full year of 2025. During the same period, the decline in China’s apparel exports to ASEAN and countries and regions along the Belt and Road narrowed. Specifically, apparel exports to ASEAN amounted to US$2.72 billion, down 8.4% year on year, with the decline narrowing by 11.2 percentage points compared with the full year of 2025. Apparel exports to countries and regions along the Belt and Road totaled US$8.14 billion, down 5.6% year on year, with the decline narrowing by 4.4 percentage points compared with the full year of 2025. Additionally, China’s apparel exports to Latin America and Africa grew by 8.7% and 29.7% year on year, respectively; exports to Russia surged by 56.5% year on year; and exports to Australia increased by 11.8% year on year.
(4) Severe Profitability Pressure on Enterprises
In Q1, the profitability of China’s apparel industry continued to recover slowly, affected by multiple factors, including weak international market demand, rising overall costs, and falling export prices. Although declines in operating revenue and total profit narrowed somewhat, the overall trajectory continued the contraction seen in 2025, and corporate profitability came under severe pressure. According to NBS data, from January to March, China had 12,541 apparel enterprises above designated size (with annual main business revenue of 20 million yuan or above), which achieved operating revenue of 242.57 billion yuan, down 1.71% year on year, with the decline narrowing by 11.50 percentage points compared with the full year of 2025. Total profit reached 5.41 billion yuan, down 17.76% year on year, with the decline narrowing by 9.58 percentage points compared with the full year of 2025. The operating profit margin was merely 2.23%, down 0.44 percentage points year on year and 1.82 percentage points below the full-year figure of 2025.
The industry’s loss-making ratio widened, and operational efficiency declined. From January to March, the loss-making ratio of apparel enterprises above designated size reached 35.60%, up 1.02 percentage points on the same period in 2025. The ratio of three expenses (selling, administrative, and financial expenses) stood at 11.65%, up 0.56 percentage points year on year. The finished goods turnover rate, accounts receivable turnover rate, and total asset turnover rate were 9.13 times/year, 5.52 times/year, and 0.99 times/year, respectively, down 3.36%, 3.68%, and 4.32% year-on-year.
Figure 4: Key Performance Indicators of the Apparel Industry in Jan.-Mar., 2026
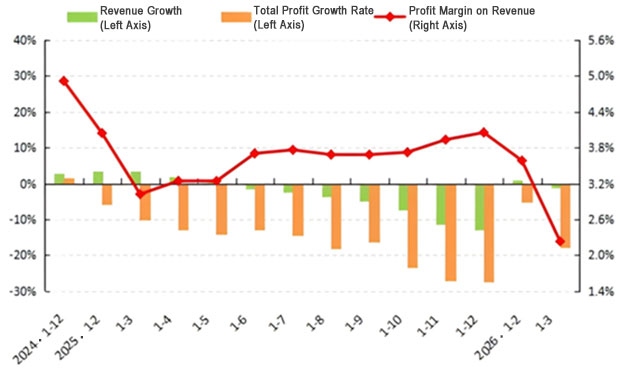
Source: National Bureau of Statistics
(5) Sharp Decline in Investment Growth
Constrained by mounting operational pressures on enterprises and a high base from the previous year, fixed-asset investment in China’s apparel industry declined sharply. According to NBS data, from January to March, fixed-asset investment in the apparel industry fell by 4.1% year on year, with the growth rate dropping by 27.0 percentage points compared with the same period of 2025 and by 9.3 percentage points compared with the full year of 2025.
Source: CHINA TEXTILE LEADER Express


Authority in Charge: China National Textile and Apparel Council (CNTAC)
Sponsor: China Textile Information Center (CTIC)
ISSN 1003-3025 CN11-1714/TS

© 2026 China Textile Leader, all rights reserved.
Powered by SeekRay