2025/10/22
Overview
In August, China’s textile and apparel exports declined more sharply, dropping from 0.1% in July to 5%. From January to August, exports decreased by 0.2%, turning the overall export value from positive to negative. Declines in knitted and woven clothing exports in August played a key role in this trend. Exports to the United States and theEuropean Union decreased, while those to ASEAN, Japan, and the “Belt and Road” countries increased.
In August, China’s exports to the U.S. fell by 25%, a 10 percentage points drop compared to the previous month. The U.S. share of the export market has decreased to 15.2%. Since the start of the tariff war, China and the U.S. have held several rounds of negotiations, the most recent being in Spain in September. Recently, both sides have engaged in increasingly intense disputes over the control of rare earth exports, agricultural exports, and flights over Russia. On October 14, the U.S. will start imposing port dues on vessels owned or operated by Chinese entities, to which China has responded by levying port dues on U.S. vessels. Given the escalating conflicts across various fields, it is possible that the Trump administration will continue to impose additional tariffs on Chinese products in the future. After a period of calm, Chinese textile and apparel exports to the United States may face greater uncertainty, and it is advisable for enterprises to prepare precautionary measures.
Amid the Federal Reserve’s consecutive policy rate reductions, the U.S. Dollar Index has declined, while global demand for the renminbi has intensified. Consequently, the CNY/USD central parity rate has appreciated for seven consecutive weeks. In the second quarter of this year, the share of cross-border settlements denominated in renminbi by Chinese enterprises exceeded that of the U.S. dollar for the first time on record. Offshore investors have concurrently increased their allocations to onshore RMB bonds and core A-share equities, exerting additional upward pressure on the offshore renminbi exchange rate. The sustained strength of the renminbi is eroding export price competitiveness and compressing corporate profit margins. Enterprises are strongly advised to formulate prudent foreign-exchange strategies and to employ appropriate hedging instruments to mitigate adverse currency movements.
Market Analysis
From January to August 2025, China’s textile and apparel trade exhibits the following characteristics: Affected by the export surge and the transfer of orders from overseas markets, textile and apparel exports in August declined both year-on-year and month-on-month, with clothing exports falling by more than 10% in the month. Textile and apparel exports reached US$26.54 billion that month, down 5% year-on-year and 0.8% month-on-month. Among them, textile exports were valued at US$12.39 billion, an increase of 1.5% year-on-year; apparel exports reached US$14.15 billion, declining by 10% year-on-year.
From January to August, the total exports of textiles and apparel amounted to US$197.28 billion, a slight decrease of 0.2%, failing to sustain the weak growth seen from January to July.
(I) In August, China’s exports to ASEAN and Japan grew, while exports to the United States, the European Union fell
In August, under the U.S. government’s reciprocal tariff policy, China’s exports to the U.S. dropped 25%, while exports to the EU fell 3.9%. However, exports to ASEAN and Japan resumed growth, with exports to ASEAN increasing by 1.9% and to Japan by 4.4%. Exports to the “Belt and Road” countries rose by 0.8% year-on-year.
From January to August, China’s textile and apparel exports to the EU and Japan grew by 4.5% and 1.1%, respectively, while exports to the U.S. and ASEAN declined by 9% and 4.9%. During this period, exports to these four traditional markets totaled US$102.05 billion, representing 51.7% of China’s total exports of textiles and apparel. Exports to countries along the Belt and Road Initiative reached US$111.78 billion, up 1.2% year-on-year, accounting for 56.7% of the total exports.
(i) Exports to the U.S.
The August U.S. consumer price index (CPI) increased by 0.4% compared to the previous month, with an annual inflation rate of 2.9%. This marks the highest level since January 2025, surpassing the 2.7% growth rate in July. The inflation rebound was mainly driven by food and fuel prices. In August, China’s exports of textiles and apparel to the United States totaled US$4.03 billion, marking a 25% year-on-year decline, with the rate of decline from the previous month increasing by 15 percentage points. The primary exports to the U.S. were knitted and woven clothing, totaling US$2.52 billion, down by 25.8% year-on-year. Among these, the export volume fell by 16.1%, while the export unit price decreased by 11.5%.
From January to August, China exported US$30.19 billion worth of textiles and apparel to the United States, which is a 9% decline compared to the previous year. The rate of decline from January to July increased by 3 percentage points. Among the main products, knitted and woven clothing exports totaled US$19.11 billion, representing a 6.4% decline year-on-year, with the decline widening by 4 percentage points from January to July. During this period, export volume rose by 0.5 percent year-on-year, while the export unit price fell by 6.9%.
Based on U.S. import data, the country imported US$11.29 billion worth of textiles and apparel in July, reflecting a 4.2% decline year-on-year. Imports from China dropped 34.5%, while imports from Vietnam increased by 15%, from India by 10.3%, and from Bangladesh by 4.9%. Exports from China, Vietnam, India, and Bangladesh accounted for 20%, 17%, 8.8%, and 6.7% of total imports, respectively. According to volume and price indexes, U.S. imports in July increased by 12.1%, but the unit price of these imports fell by 14.6%.
(ii) Exports to ASEAN
In August, the ASEAN economy was impacted by U.S. tariff policies, leading to slower growth in most countries. Although some nations, such as Vietnam and Indonesia, have negotiated lower tax rates with the United States, policy risks and the “grab exports” effect have weakened ASEAN regional economic growth, which remains under pressure. In August, China exported US$3.9 billion worth of textiles and clothing to ASEAN, marking a 1.9% increase year-on-year and an 8% rise compared to the previous month; of this, yarn fabric exports reached US$2.35 billion, up 9.4% year-on-year. Exports to Vietnam increased by 4% year-on-year, while exports to Cambodia rose by 25%. Apparel exports totaled US$800 million, reflecting a 16.6% decline year-on-year.
From January to August, China exported US$33.15 billion worth of textiles and apparel to ASEAN, seeing a 4.9% decrease compared to last year. Of this, US$11.51 billion went to Vietnam, down by 4.3% year-on-year; US$4.63 billion to Cambodia, a 17.7% year-on-year increase; and US$3.72 billion to Indonesia, a 5.9% growth. Regarding product categories, from January to August, China exported US$18.31 billion worth of yarn and fabrics to ASEAN, up by 1.1% year-on-year, and US$8.32 billion worth of apparel, down by 16.3% compared to last year.
(iii) Exports to the EU
Eurostat data showed that annual inflation in the EU was 2.4% in August 2025, remaining unchanged from July and a year earlier; in the euro area, it was 2.0%. Cyprus (0.0%), France (0.8%), and Italy (1.6%) had the lowest annual inflation rates, while Romania (8.5%), Estonia (6.2%), and Croatia (4.6%) experienced the highest. China’s textile and apparel exports to the EU totaled US$3.95 billion in August, seeing a 3.9% year-on-year decline, wider by 1.7 percentage points than in July. From a country perspective, China’s textile and apparel exports to the top three export destinations—Germany, Spain, and the Netherlands—reached US$680 million, US$650 million, and US$500 million, respectively. Exports to Spain increased by 15.9%, while exports to Germany and the Netherlands decreased by 9.7% and 7.9%, respectively, year-on-year. Regarding products, in August, exports of knitted clothing to the EU were worth US$2.44 billion, seeing a 3.7% decline from the previous year.
From January to August, China’s textiles and apparel exports to the EU totaled US$28.39 billion, increasing 4.5% year-on-year, 1.6 percentage points lower than the January-July performance; exports of knitted and woven apparel reached US$17.26 billion, up by 6.7%.
Based on the EU import data, the EU imported US$13.19 billion worth of textiles and apparel in July, reflecting a 14.7% increase. The top three sources of imports were China, Bangladesh, and Turkey, with imports totaling US$3.33 billion, US$1.59 billion, and US$1.1 billion, respectively. These three accounted for 34%, 15%, and 10% of the total imports. From a year-on-year perspective, imports from China rose by 23%, imports from Bangladesh increased by 15%, and imports from Turkey slightly decreased by 0.4%.
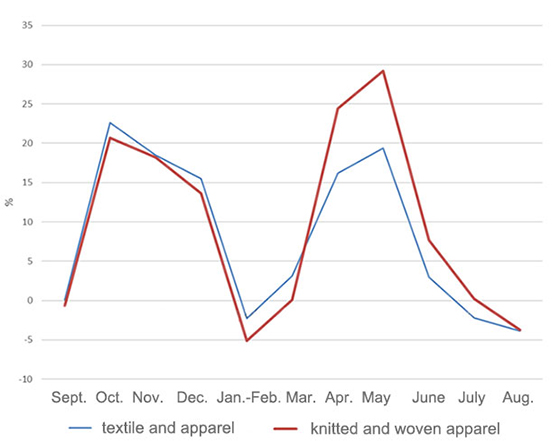
Figure 1: Y-o-Y Growth of China’s Textile and Apparel Exports to the 27 European Union Member Countries from September 2024 to August 2025
(iv) Exports to Japan
In August, the Japanese government lowered its forecast for real GDP growth in fiscal year 2025 to 0.7% from the previous estimate of 1.2%. The US tariff increase remains the biggest external risk to the Japanese economy. In August, China exported US$1.59 billion worth of textiles and apparel to Japan, a 4.4% increase year-on-year. Among the main products, exports of knitted and woven clothing totaled US$1.08 billion, a 4.7% rise. Export volume went up by 10.1%, while the unit price fell by 4.9%. From January to August, China’s total exports of textiles and apparel to Japan reached US$10.32 billion, a 1.1% increase compared to last year. Specifically, exports of knitted and woven garments amounted to US$6.68 billion, up 1.5% year-on-year; export volume increased by 4.2%, but the unit price decreased by 2.6%.
According to Japan’s import data, in July, Japan imported US$2.78 billion worth of textiles and apparel, a 1.5% rise from the previous year. The top three sources were China, Vietnam, and Italy, with imports of US$1.34 billion, US$520 million, and US$130 million, respectively, making up 48%, 19%, and 5%. Imports from China, Vietnam, and Italy grew by 0.9%, 5.8%, and 8.5% year-on-year, respectively.
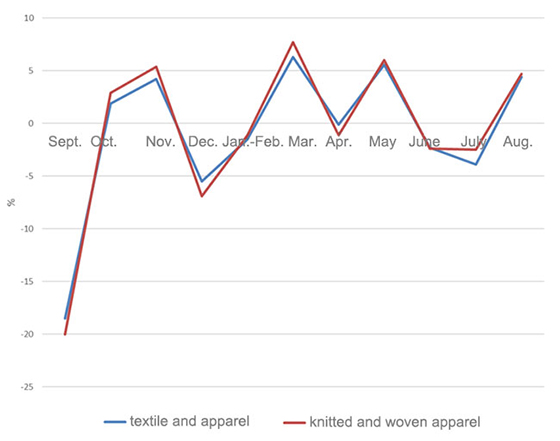
Figure 2: Y-o-Y Growth of China’s Textile and Apparel Exports to Japan from September 2024 to August 2025
(v) Exports to the “Belt and Road” countries
In August, China exported US$14.33 billion worth of textiles and apparel to the “Belt and Road” countries, a 0.8% increase from the previous year. The growth rate slowed by 3 percentage points compared to the previous month. Exports to Brazil increased by 3.5%, exports to Poland jumped by 15%, exports to Pakistan soared by 34%, and exports to Nigeria rose by 13%.
From January to August, China exported US$111.78 billion worth of textiles and apparel to the “Belt and Road” countries, reflecting a 1.2% increase year-on-year. Among the destinations, exports to Kyrgyzstan rose by 1.9%, to Brazil by 1.9%, to Nigeria by 36.9%, to Poland by 11.6%, to Chile by 21%, and to Pakistan by 34%. The “Belt and Road” market accounted for 56.7% of China’s total exports.
(II) In August, yarn and fabric exports grew, and knitted and woven clothing exports fell
In August, the export value of yarn and fabrics grew by 2.5% and 4.4% year-on-year, while the export value of home textiles and knitted and woven garments declined by 3.4% and 9.9%, respectively. The export volume of yarn, fabrics, and home textiles increased by 16.9%, 16.8%, and 1%, respectively, whereas the export volume of knitted and woven garments decreased by 2.9%. The unit prices of four categories—yarn, fabrics, home textiles, and knitted and woven apparel—continued to fall, dropping by 12.3%, 10.6%, 4.3%, and 7.2%, respectively.
From January to August, the cumulative export value of textiles totaled US$94.52 billion, seeing a year-on-year increase of 1.6%; apparel exports were US$102.77 billion, down by 1.7% year-on-year. Among the four categories of commodities, the exports of yarn and fabrics increased by 5.3 % and 2.3 % respectively, and those of home textiles and knitted and woven garments decreased by 0.3 % and 1.6 % respectively. All the four categories of commodities showed the trend of volume increase and price decrease, in terms of export volume, yarn, fabrics, home textiles and knitted and woven garments increased by 13.5%, 11.2%, 9.9% and 4.1%, respectively; in terms of export price, yarn, fabrics, home textiles and knitted and woven garments decreased by 7.2%, 8%, 9.3% and 5.5%, respectively. On the whole, the prices of manufactured goods fell more than those of intermediate goods, and the profit margins of manufacturers of manufactured goods were squeezed.
(III) In August, exports rose only in Zhejiang among the key regions, while those of Jiangsu, Guangdong, and Shandong fell significantly
In August, only Zhejiang recorded year-on-year export growth (+0.9%) among the seven leading regions; exports from Jiangsu, Guangdong, Shandong, Fujian, Shanghai, and Xinjiang fell 6.4%, 7.8%, 13.9%, 4.7%, 5.1% and 1.7% respectively.
During January–August, Zhejiang, Jiangsu, Shandong, and Shanghai maintained forward momentum, rising 4.7%, 0.8%, 4.7% and 1.8%, while Guangdong, Fujian, and Xinjiang declined 8.1%, 13.3% and 2.5%. Nationwide, 20 of the 31 provincial-level regions (excluding Hong Kong, Macao, and Taiwan) posted export increases, led by Hubei (+15%), Beijing (+10%), Heilongjiang (+33%), Chongqing (+41%), and Yunnan (+14%).
(IV) Cotton: output up, imports down
According to the China Cotton Association, the 2024/25 season saw Chinese cotton production rise 13.4% to 6.66 million tons, while imports plunged 67.6% to 1.05 million tons. Domestic supply is therefore ample. The operating environment remains difficult: global demand is volatile, textile and apparel exports are under pressure, domestic consumption is only inching up, and polyester continues to erode cotton’s share. As a result, most cotton-spinning mills are loss-making and spot prices trended lower through the year. Still, Xinjiang’s new spindle capacity lifted the local utilization rate and accelerated cotton consumption, pushing end-season commercial stocks to a historic low. Total cotton use is estimated at 7.8 million tons (−1.3% y-o-y), with ending stocks at 9.85 million tons (−1.0% y-o-y).
In August, Chinese cotton imports remained depressed by U.S. tariffs and other headwinds, but the release of additional sliding-scale duty quotas allowed a partial recovery. Customs data show that August arrivals reached 73,000 tons, still 51.6% below the same month last year but 36.9% higher than in July. Australia dominated the basket, supplying 77% of the volume as its new-crop cotton reached the market; Brazil contributed 15%.
For the 2024/25 marketing year (Aug.–Jul.) China has so far imported 1.05 million tons of cotton, slumped by 67.5 % year on year.
During January–August, the cumulative imports of chemical fibers fell by 7.5 %, while their average unit price rose 1.9%.
Source: CHINA TEXTILE LEADER Express


Authority in Charge: China National Textile and Apparel Council (CNTAC)
Sponsor: China Textile Information Center (CTIC)
ISSN 1003-3025 CN11-1714/TS

© 2026 China Textile Leader, all rights reserved.
Powered by SeekRay