
2026/10/22
During January–August 2026, geopolitical tensions continued to evolve and global commodity prices, particularly energy prices, remained volatile, affecting the stability of global industrial and supply chains. China’s economy, meanwhile, remained broadly stable and continued to develop in a more innovative and higher-quality direction. New growth drivers in industry strengthened, while the consumer market improved steadily in quality. Against this backdrop, China’s technical textiles industry maintained stable operations, with growth in industrial value added continuing to edge upward.
I. Production and Profitability
On the production side, output of major products continued to grow at a healthy pace. According to the National Bureau of Statistics, output of nonwovens and tire cord fabric by enterprises above the designated size increased by 9.4% and 5.2%, respectively, year on year in January–August.
In terms of financial performance, industry revenue grew steadily, but profitability remained under pressure, with businesses facing the widespread challenge of ‘higher revenue without higher profits’. According to National Bureau of Statistics data, operating revenue among above-designated-size enterprises in the technical textiles industry rose 4.5% year on year in January–August, while total profits declined 1.7%. The operating profit margin stood at 3.4%, down 0.2 percentage points year on year.
Performance by segment among enterprises above the designated size in January–August was as follows:
The recovery in nonwovens profitability continued. Operating revenue and total profits rose 6.7% and 21%, respectively, year on year; the operating profit margin reached 2.5%, up 0.3 percentage points.
Among rope, cord and cable manufacturers, operating revenue rose 5.4% year on year, while total profits declined 0.9%; the operating profit margin was 3.0%, down 0.2 percentage points.
Among manufacturers of textile webbings and tire cord fabrics, operating revenue fell 0.2% and total profits declined 13.1%; the operating profit margin stood at 3.3%, down 0.5 percentage points.
In the tarpaulin and canvas segment, operating revenue increased 6.2% year on year, but total profits fell 1.6%; the operating profit margin was 4.0%, down 0.3 percentage points.
Among other technical textiles manufacturers, including producers of construction and protective textiles, operating revenue rose 2.3%, while total profits fell 13.2%. The operating profit margin stood at 5.0%, a decline of 0.9 percentage points year on year.
II. Foreign Trade
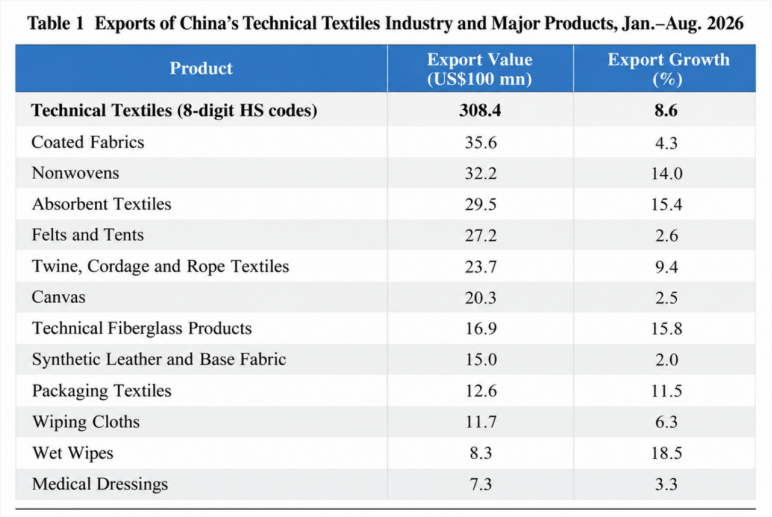
In international trade, export growth in the industry accelerated for the fifth consecutive month. According to China Customs data compiled at the eight-digit HS code level, technical textiles exports totaled US$30.84 billion in January–August 2026, up 8.6% year on year, while imports reached US$3.77 billion, up 4.9%. Export performance by product category is shown in table 1.
Source: China Customs; China Technical Textiles Association
In January–August 2026, the United States, Vietnam and Japan were the three largest export markets for China’s technical textiles, with shipments worth US$3.61 billion, US$2.37 billion and US$1.52 billion, respectively. These figures represented year-on-year growth of 8.9%, 10.5% and 4.9%. Exports to Russia recorded particularly strong growth of 24.2%, while exports to Thailand, Germany and other markets also increased by more than 10% year on year.
Source: CHINA TEXTILE LEADER Express


Authority in Charge: China National Textile and Apparel Council (CNTAC)
Sponsor: China Textile Information Center (CTIC)
ISSN 1003-3025 CN11-1714/TS

© 2026 China Textile Leader, all rights reserved.
Powered by SeekRay