2025/5/21

Overview
In the first quarter of 2025, China’s textile and apparel industry fully capitalized on the advantages of its robust and comprehensive industrial chain. Exports demonstrated resilience and experienced slight growth despite the complex and turbulent trade environment. From January to March, China’s textile and apparel exports totaled US$66.29 billion, reflecting a year-on-year growth of 1%. The increase in exports was primarily driven by the de minimis waiver parcel and the lower base of last year. Notably, in March, textile and apparel exports demonstrated even faster year-on-year growth, surging by 12.9%, which helped positively elevate the overall export performance for the first quarter.
Foreign Trade Analysis
According to data from the General Administration of Customs, China’s textile and apparel exports reached US$23.4 billion in March, marking a year-on-year increase of 12.9% and a substantial improvement of 16 percentage points compared to the first two months this year. Cumulative exports of textiles and apparel in the first quarter totaled US$66.29 billion, reflecting a 1% year-on-year increase. Among them, textile exports totaled US$33.27 billion, up by 4% year-on-year; apparel exports reached US$33.01 billion, down by 1.9% year-on-year.
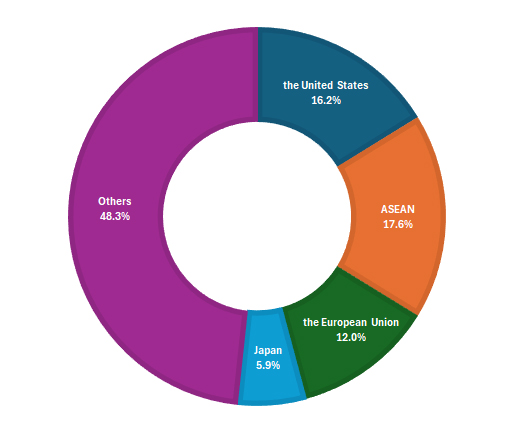
In the first quarter, China’s textile and apparel exports to the United States maintained a year-on-year growth of 8.2%. Exports to the European Union and Japan grew by 3.1% and 1.5%, respectively. Exports to ASEAN fell by 7.6%, although the rate of decline narrowed. ASEAN accounted for 17.6% of China’s textile and apparel exports, 2 percentage points higher than in the first two months. From January to March, China exported US$34.29 billion of products to these four traditional major markets, accounting for 51.7% of total exports. Meanwhile, exports to the “Belt and Road” countries amounted to US$37.56 billion, marking a year-on-year decline of 1.3% and accounting for 56.7% of total exports.
Figure 1: The Share of Major Export Destinations for China’s Textile and Apparel in Q1, 2025
(A) The United States
In the first quarter, China exported US$10.74 billion worth of textiles and apparel to the United States, up 8.2% year-on-year, 4 percentage points higher than the January-February expansion. The knitted and woven clothing exports amounted to US$6.57 billion, reflecting an increase of 11.3%. In March alone, China exported US$3.57 billion worth of textiles and apparel to the United States, surging 17% year-on-year, 13 percentage points above the January-February period. The knitted and woven clothing exports reached US$2.12 billion, up by 22.3% year-on-year.
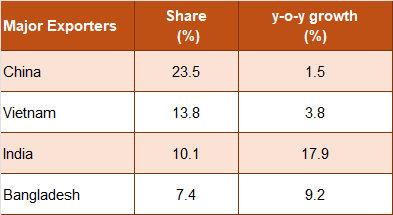
Table 1: The U.S. Textile and Apparel Imports from Major Exporters in February 2025
(B) ASEAN
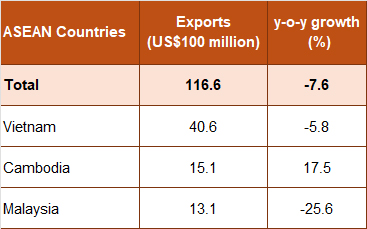
Table 2: China’s Textile and Apparel Exports to ASEAN Countries in Q1, 2025
The ASEAN+3 Macroeconomic Research Office (AMRO) forecasts that the growth rate of ASEAN economies will be 4.8% in 2025. This forecast indicates that ASEAN will be relatively less affected by the tariffs imposed by the U.S. compared to economies like China, Japan, and South Korea. This relative advantage may further enhance ASEAN’s appeal as an investment and trade destination amid ongoing trade tensions between the U.S. and China.
(C) The European Union
In the first quarter, China exported US$7.97 billion worth of textiles and clothing to the European Union, representing an increase of 3.1%. The knitted and woven clothing exports accounted for US$4.22 billion, reflecting a growth of 0.1%.
Eurostat released inflation data for March 2025, indicating that the euro area’s inflation rate is 2.2%, down 0.1 percentage points from February. From a country-by-country perspective, in March, the E.U.’s major economies of Germany, France, Italy, and Spain reported inflation rates of 2.3%, 0.9%, 2.1%, and 2.2%, respectively. China exported US$2.41 billion in textiles and apparel to the E.U. in March, reflecting an 18.2% year-on-year increase. From a country-specific point of view, there was more growth in exports to Germany, the Netherlands, and France in March. China’s textiles and apparel exports to these three countries were US$400 million, US$320 million, and US$300 million, respectively, up by 18%, 8%, and 17%. From the product perspective, March saw an increase of 16.9% in knitted and woven clothing exports to the E.U., reaching US$1.17 billion.
From the E.U. import data, in February, the E.U. imported textiles and apparel worth US$10.41 billion, a 9.7% increase year-on-year. The top three sources of imports were China, Bangladesh, and Turkey, with imports totaling US$3.2 billion, US$1.76 billion, and US$1.1 billion, respectively, accounting for 31%, 17%, and 11%, respectively. From the year-on-year perspective, imports from China and Bangladesh ballooned by 15.3% and 22.9%, respectively, while imports from Turkey fell by 7.2%.
(D) Japan
In the first quarter, China’s textiles and apparel exports to Japan totaled US$3.92 billion, representing an increase of 1.5% year-on-year. Among them, the exports of knitted and woven apparel reached US$2.56 billion, marking a rise of 2.3%.
In 2025, wage increases in Japan’s spring wage negotiations reached a record high, leading to a potential recovery of consumer demand in the second quarter. In March, China exported US$1.56 billion worth of textiles and apparel to Japan, marking an increase of 6.3% year-on-year, which represents an improvement of 7 percentage points compared to the previous month. The exports of knitted and woven apparel totaled US$1.04 billion, up by 7.7% year-on-year.
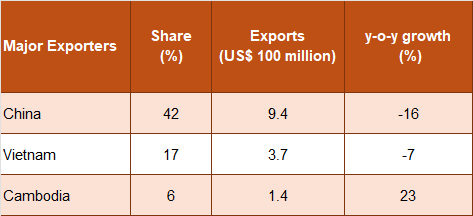
Table 3: Japanese Textile and Apparel Imports from Major Exporters in February 2025
(E) The “Belt and Road” countries
In the first quarter, China’s textiles and apparel exports to the “Belt and Road” countries totaled US$37.56 billion, declining 1.3% year-on-year, which is 6 percentage points narrower than the decline observed in the first two months.
Among them, exports to South Korea increased by 3.5%, exports to Kyrgyzstan grew by 3.6%, exports to Brazil rose by 6.5%, exports to Chile surged by 20.9%, exports to Nigeria soared by 25.4%, and exports to Pakistan climbed sharply by 40%. The proportion of the “Belt and Road” market in China’s exports rose to 56.7%.
In March, China exported US$13.77 billion of textiles and apparel to the “Belt and Road” countries, up 12.6% year-on-year. Thereinto, exports to Kyrgyzstan soared by 35%, exports to Nigeria surged by 103%, exports to Brazil increased by 24%, exports to the United Arab Emirates grew by 25%, exports to Saudi Arabia increased by 20%, and exports to Pakistan surged by 84%.
Domestic Performance
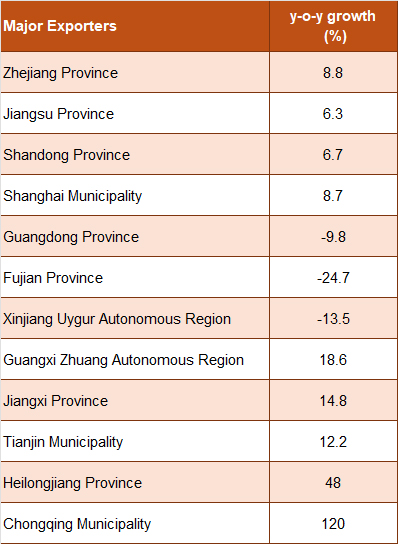
In the first quarter, Zhejiang Province, Jiangsu Province, Shandong Province, Shanghai Municipality, Guangdong Province, Fujian Province, and Xinjiang Uygur Autonomous Region are the top 7 key areas for textile and apparel exports. Additionally, 19 out of China’s 31 provinces (cities and regions, excluding Hong Kong, Macao, and Taiwan) achieved growth. (Table 4)
Table 4: Y-o-Y growth of China’s Major Textile and Apparel Exports Sources in Q1, 2025
Stable Cotton Price in China
According to the China Cotton Association, China’s economy showed a positive trend in March, but the impact of external shocks has increased. Boosted by a series of policies aimed at stimulating consumption, the national consumer market has recovered steadily, and the cotton textile industry has entered the traditional peak season, leading to further improvements in enterprise production and sales. Despite some fluctuations caused by tariffs imposed by the U.S., the domestic cotton price trend remains relatively stable compared to the sharp fluctuations in international cotton prices.
In the first quarter, China imported 338,000 tons of cotton, seeing a year-on-year decline of 67.4%. In March, textile enterprises faced a decrease in demand for imported cotton, leading to a significant drop in cotton imports. That month, China imported 74,000 tons of cotton, slumping 81.4% year-on-year decrease and a 41.7% month-on-month decline. Among the source countries for imports, Brazilian cotton were 44,000 tons, dropped by 73.5% year-on-year; imports of U.S. cotton reached 14,000 tons, reflecting a year-on-year decline of 90.3%.
Source: CHINA TEXTILE LEADER Express


Authority in Charge: China National Textile and Apparel Council (CNTAC)
Sponsor: China Textile Information Center (CTIC)
ISSN 1003-3025 CN11-1714/TS

© 2026 China Textile Leader, all rights reserved.
Powered by SeekRay