2025/12/19
Since 2025, China’s economy has progressed despite pressures. Facing severe challenges from external tariffs and domestic demand, proactive macroeconomic policies have stabilized market expectations and confidence. GDP grew by 5.2% year-on-year in the first three quarters, establishing a solid macroeconomic foundation for the chemical fiber industry. During this period, chemical fiber production remained steady, inventory pressures eased, and export growth sped up, serving as key pillars supporting the industry’s stable operation. Regarding economic performance, although chemical fiber prices declined in the third quarter due to weaker raw material support—resulting in a year-over-year decrease in operating revenue for the first three quarters—the lower raw material prices also expanded profit margins for chemical fibers. This led to an improvement in total profits compared to the same period last year.
Industry Operation Overview
(A) Production
In the first three quarters, overall production capacity utilization in the chemical fiber industry remained normal, though performance varied across sub-sectors. For example, the polyester filament segment maintained higher operating rates than the same period last year. The average operating rate peaked at 94% in March, the highest of the year. Some companies cut production capacity in the second quarter, causing the average rate to drop to 90% in June. In the third quarter, the average rate recovered to 92%, up 3.29 percentage points from the same period last year. The polyamide fiber sector faced notable market pressure, with operating rates falling steadily since April. The first three quarters saw an average operating rate of 83%, a 6.27 percentage-point year-on-year decrease, and in October, the rate had fallen to 75%. The spandex sector operated at low capacity utilization, averaging 80% in the first three quarters, down 4.84 percentage points from the same period of last year.
According to data from the National Bureau of Statistics, in the first three quarters, China’s chemical fiber output increased by 5.6% year-on-year. Although the growth rate slowed compared to the same period and the full year of 2024, it rose by 0.69 percentage points from January-June. Overall, production remained largely stable (Figure 1).
Figure 1: The Growth Rate of Chemical Fibers Output from the Beginning of 2025
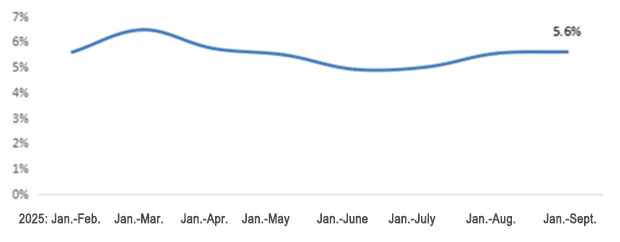
Source: National Bureau of Statistics, China Chemical Fibers Association (CCFA)
(B) Market & Price
Since 2025, the average crude oil price has stayed below that of the same period last year. The first half of the year saw wide fluctuations between US$55 and US$80 per barrel; the third quarter showed a declining trend between US$60 and US$70 per barrel.
With weaker support from raw materials, market prices for chemical fiber products declined year-over-year. In the polyester chain, fiber product prices in the first quarter generally fell more sharply than their raw materials, narrowing profit margins. In the second quarter, although fiber product prices increased, the rise usually lagged behind raw material costs, further tightening profit margins. In the third quarter, while fiber product prices continued to decline, raw material costs fell more sharply, widening processing margins. For the polyamide chain, prices across all segments declined by around 20% in the first three quarters (Table 1).
Table 1: Price Change of Main Chemical Fibers and Raw Materials Since the Beginning of 2025
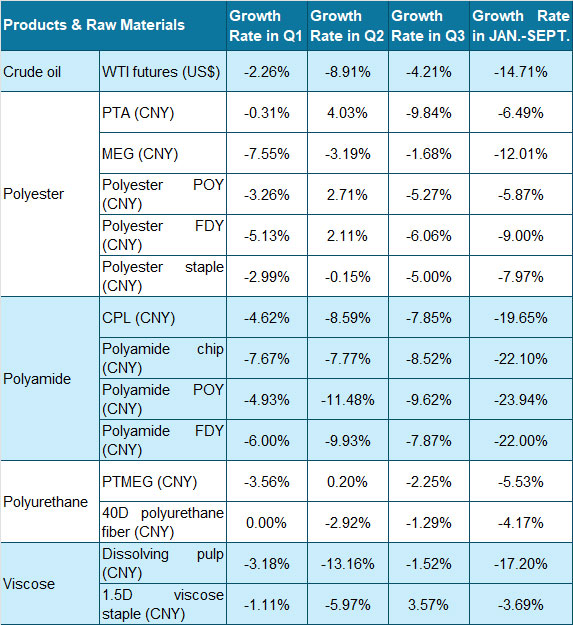
Source: China Customs
(C) Foreign Trade
According to China Customs statistics, cumulative exports of major chemical fiber products totaled 5.2 million tons from January to September, up 15.85% year-on-year and sustaining a growth trend (Table 2). Among them, polyester filament exports increased by 11.99% year-on-year, with monthly volumes in January and May both nearing 400,000 tons. Polyester staple exports surged 30.63% year-on-year, with monthly exports surpassing 160,000 tons in both May and August.
Notably, on November 12, India revoked its BIS certification requirements for China’s purified terephthalic acid (PTA), ethylene glycol (MEG), 100% polyester staple yarn, polyester industrial yarn (IDY), polyester staple fiber (PSF), polyester fully drawn yarn (FDY), and polyester pre-oriented yarn (POY). Under the previous BIS policy, China’s polyester filament exports to India were significantly impacted. In October 2023, exports to India dropped from 82,000 metric tons in September to 9,000 metric tons. Last year’s exports to India totaled 160,000 metric tons, a 69.91% decline from the previous year. From January to September 2025, exports to India reached 210,000 metric tons, showing a year-on-year recovery but still below pre-BIS policy levels. Additionally, India’s weaving sector has seen substantial growth in recent years. For example, China’s exports of weaving machinery to India from January to September 2025 ballooned by 92.55% year-on-year, indicating strong ongoing demand for polyester filament yarn in India. Overall, the removal of BIS certification is expected to boost China’s polyester filament yarn exports to India in the short term.
Table 2: Foreign Trade of Chemical Fiber Products in Jan.-Sept., 2025
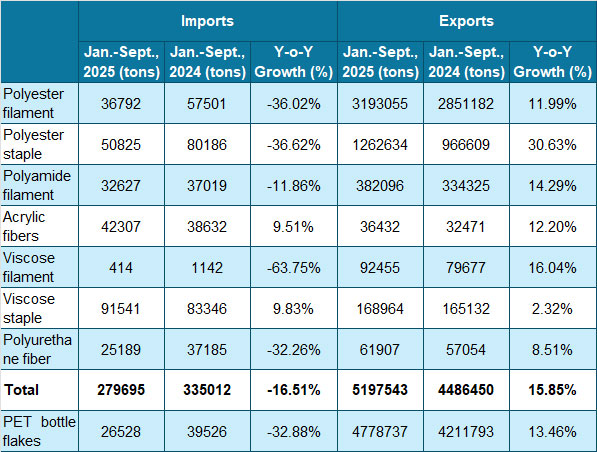
Source: Based on data from China Customs
(D) Domestic sales & foreign sales
This year, the national campaign to boost consumption has been steadily advancing, with consistent growth in residents’ demand for clothing. Domestic sales of textiles and apparel grew moderately during the first three quarters. According to data from the National Bureau of Statistics, retail sales of clothing, foot & head wear, and knitted textiles above designated size reached nearly 1.1 trillion yuan from January to September, marking a 3.1% year-on-year increase—a 2.9 percentage point rise compared to the same period last year. Online retail channels for textiles and apparel continued to improve on a quarter-by-quarter basis. From January to September, China’s online retail sales of wearing goods grew by 2.8% year-on-year, accelerating by 2.9 and 1.4 percentage points compared to the first quarter and the first half of this year, respectively. Growth-oriented consumption segments such as Chinese chic and sports/outdoor apparel remained strong. Business models like live-streaming e-commerce helped the industry fully meet consumers’ diverse, high-quality, and personalized textile and apparel needs, driving synchronized growth in both online and offline sales.
Amid rising tariff conflicts and global restructuring of the textile supply chain, the industry’s foreign trade faced increased pressure and volatility. According to China Customs, textile and apparel exports totaled US$221.69 billion from January to September, down 0.3% year-on-year, marking two consecutive months of negative overall growth. Regarding export product structure, China’s key intermediate goods, such as chemical staple fiber and textile yarn, showed strong growth, driving textile exports to US$106.48 billion in the first three quarters—a 2.1% year-on-year increase—supporting export resilience. However, due to multiple complex factors—including tariff disruptions, slow recovery in overseas demand, and the prolonged destocking cycle of international brands—pressure on apparel exports has intensified. From January to September, apparel exports totaled US$115.21 billion, down 2.5% year-on-year, with the decline gradually deepening.
From the perspective of export market structure, China’s textile and apparel exports to major global trading partners showed increasing divergence. Due to U.S. tariff policies and re-export trade inspections, exports to the United States and ASEAN declined significantly, with year-on-year decreases of 10.1% and 4.7% respectively, from January to September. Faced with a complex global trade environment, foreign trade enterprises have actively promoted market structure optimization and business layout adjustments, significantly expanding into diverse international markets. This has gradually strengthened support for industry exports. In the first three quarters of this year, China’s textile and apparel exports to trading partners such as the EU, the UK, India, Canada, Nigeria, and Chile all grew strongly.
(E) Revenue & Benefits
Since 2025, all parts of the textile industry chain have generally shown stronger performance on the production side than on the demand side. Data indicates that from January to September, the chemical fiber industry’s operating revenue dropped by 4.92% year-over-year, mainly due to lower product prices compared to the same period last year (Table 3). Total profits increased by 6.53% year-over-year. Within this sector, the polyester industry saw total profits decline by 2.69% year-over-year, an improvement of 8.09 percentage points over the January-June period. The cellulose fiber (including acetate fiber) and bio-based chemical fiber industries displayed stronger profitability, with total profits rising by 17.44% and 66.68% year-on-year, respectively.
Table 3: Economic Benefit of Chemical Fiber and Related Industries in Jan.-Sept., 2025
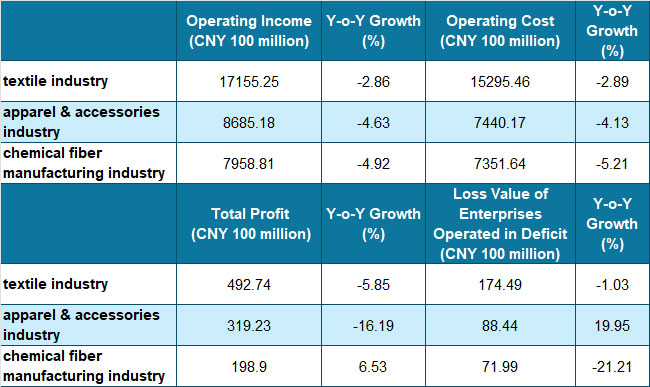
Source: National Bureau of Statistics
(F) Investment
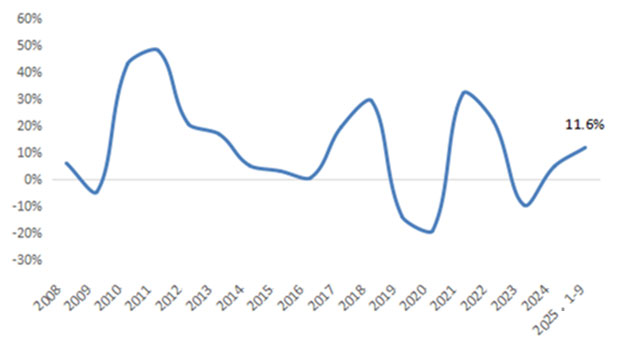
Data from the National Bureau of Statistics show that from January to September, fixed-asset investment in the chemical fiber industry grew by 11.6% year-on-year, up 1 percentage point from the first half of this year. Upgrades and renovations of existing production capacity contributed to the growth in fixed-asset investment. For example, some companies increased investments in automating production facilities, upgrading and expanding older production lines, and renovating supporting equipment such as waste heat recovery and cooling systems.
Regarding new capacity additions, polyester production capacity grew by around 4.7 million tons from January to September. Polyester filament contributed about 1.05 million tons, indicating a slowdown in growth. Polyester staple increased by 100,000 tons, easing growth pressures. While bottle flakes and films added roughly 3.15 million tons of capacity, they continue to expand at a relatively fast pace.
Figure 2: Fixed-Assets Investment Growth (Y-o-Y) of the Chemical Fiber Industry from 2008 to Jan.-Sept, 2025
Source: National Bureau of Statistics
Source: CHINA TEXTILE LEADER Express


Authority in Charge: China National Textile and Apparel Council (CNTAC)
Sponsor: China Textile Information Center (CTIC)
ISSN 1003-3025 CN11-1714/TS

© 2026 China Textile Leader, all rights reserved.
Powered by SeekRay